library(plotly)

plot_ly(cars, x = ~speed, y = ~dist) %>%
  add_markers()
plotly scatter plot
![]()
本书此部分介绍如何通过htmlwidgets包整合R与JavaScript。htmlwidgets包起源于2012年的rCharts包,该包常用来数据可视化,但不限于此。在学习如何编写自己的第一个widget前,本章先介绍一些已经在CRAN上存在的widgets,通过它们,了解htmlwidgets包如何工作。
plotly包提供了plotly.js在R中的API接口,可以绘制超40种,包括3D,统计,地理等方面的图形。
有关plotly包的更多介绍见:Interactive web-based data visualization with R, plotly, and shiny。
下面是一个可以交互的简单示例:
library(plotly)
plot_ly(cars, x = ~speed, y = ~dist) %>%
add_markers()plotly scatter plot
plotly包也可以使用ggplotly()函数将ggplot2绘制的静态图进行转换(仅支持部分类型图):
p <- ggplot(diamonds, aes(x = log(carat), y = log(price))) +
  geom_hex(bins = 100)
ggplotly(p)
Interactive ggplot2 with plotly
plotly包使用类似ggplot2包中的geom语法——add_*添加图层。
plot_ly(mtcars, x = ~disp) %>%
  add_markers(y = ~mpg, text = rownames(mtcars)) %>%
  add_lines(y = ~ fitted(loess(mpg ~ disp)))
Multiple layers with plotly
DT package 可以根据data.frame创建交互表格。
DT::datatable(cars)Interactive table with DT
DT 创建的表格也十分常见地用在shiny中。
library(DT)
library(shiny)

ui <- fluidPage(
  fluidRow(
    column(8, DTOutput("myTable")),
    column(
      4,
      h4("Indices of selected rows"),
      verbatimTextOutput("selected")
    )
  )
)

server <- function(input, output) {
  output$myTable <- renderDT({
    datatable(mtcars)
  })

  output$selected <- renderPrint({
    input$myTable_rows_selected
  })
}

shinyApp(ui, server)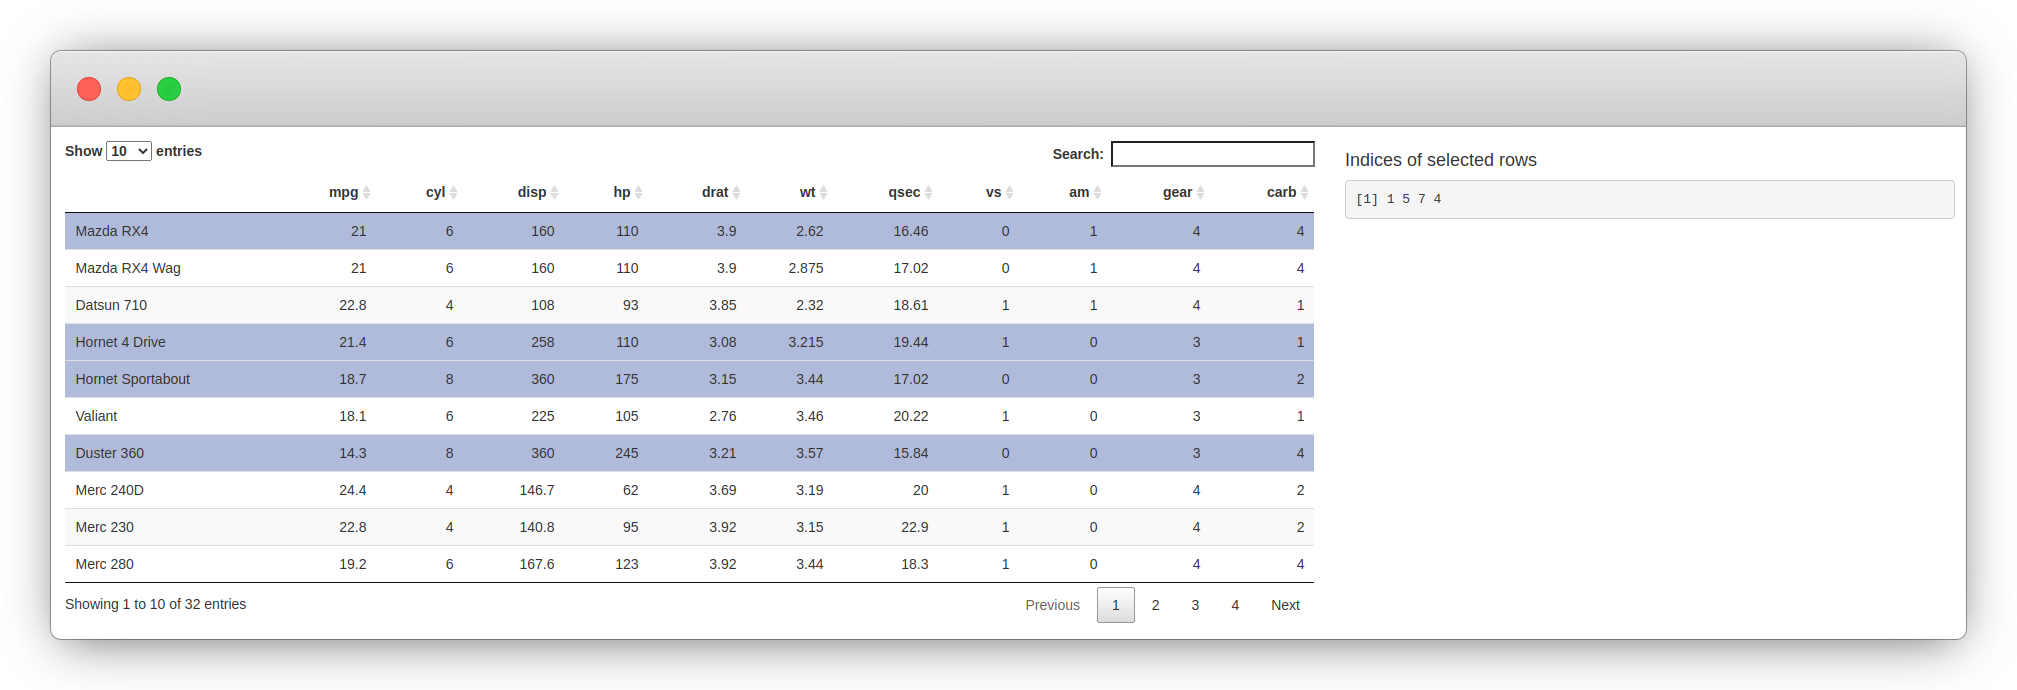
crosstalk包允许多个htmlwidgets之间进行数据交流。下面是一个共享数据的图标与散点图的示例。更多支持的widgets见:Crosstalk.
library(DT)
library(plotly)
library(crosstalk)

sd <- SharedData$new(iris[, c("Sepal.Length", "Sepal.Width")])

bscols(
  device = "lg",
  datatable(sd, width = "100%"),
  plot_ly(sd, x = ~Sepal.Length, y = ~Sepal.Width)
)
DT and plotly with crosstalk